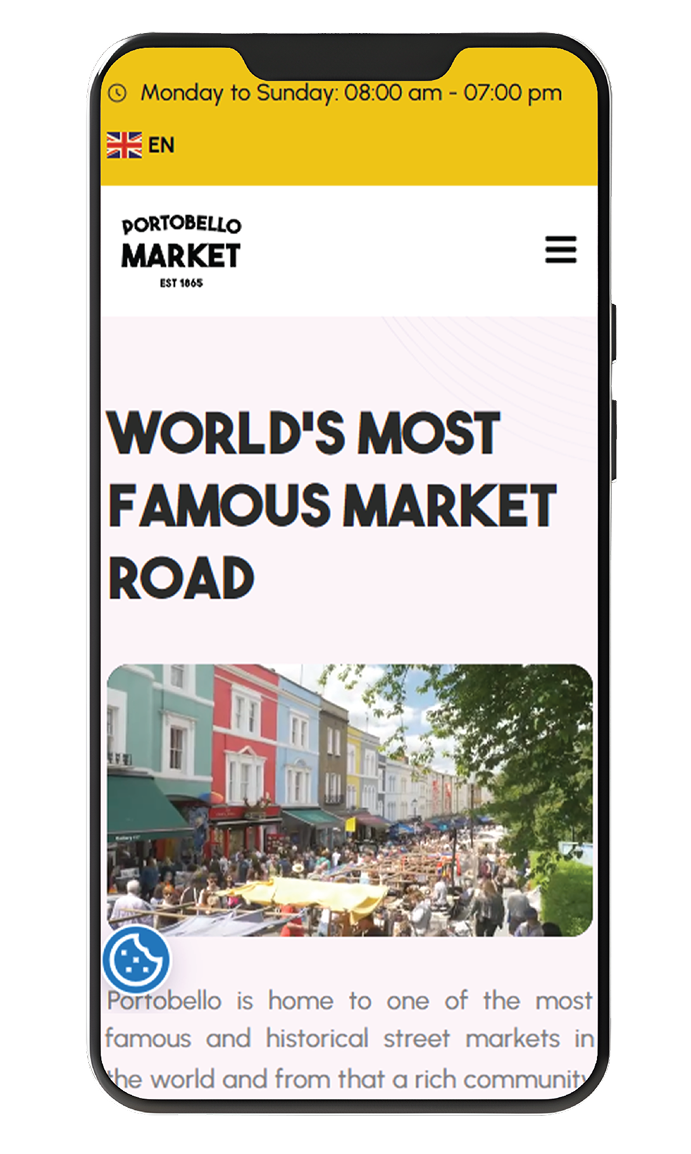
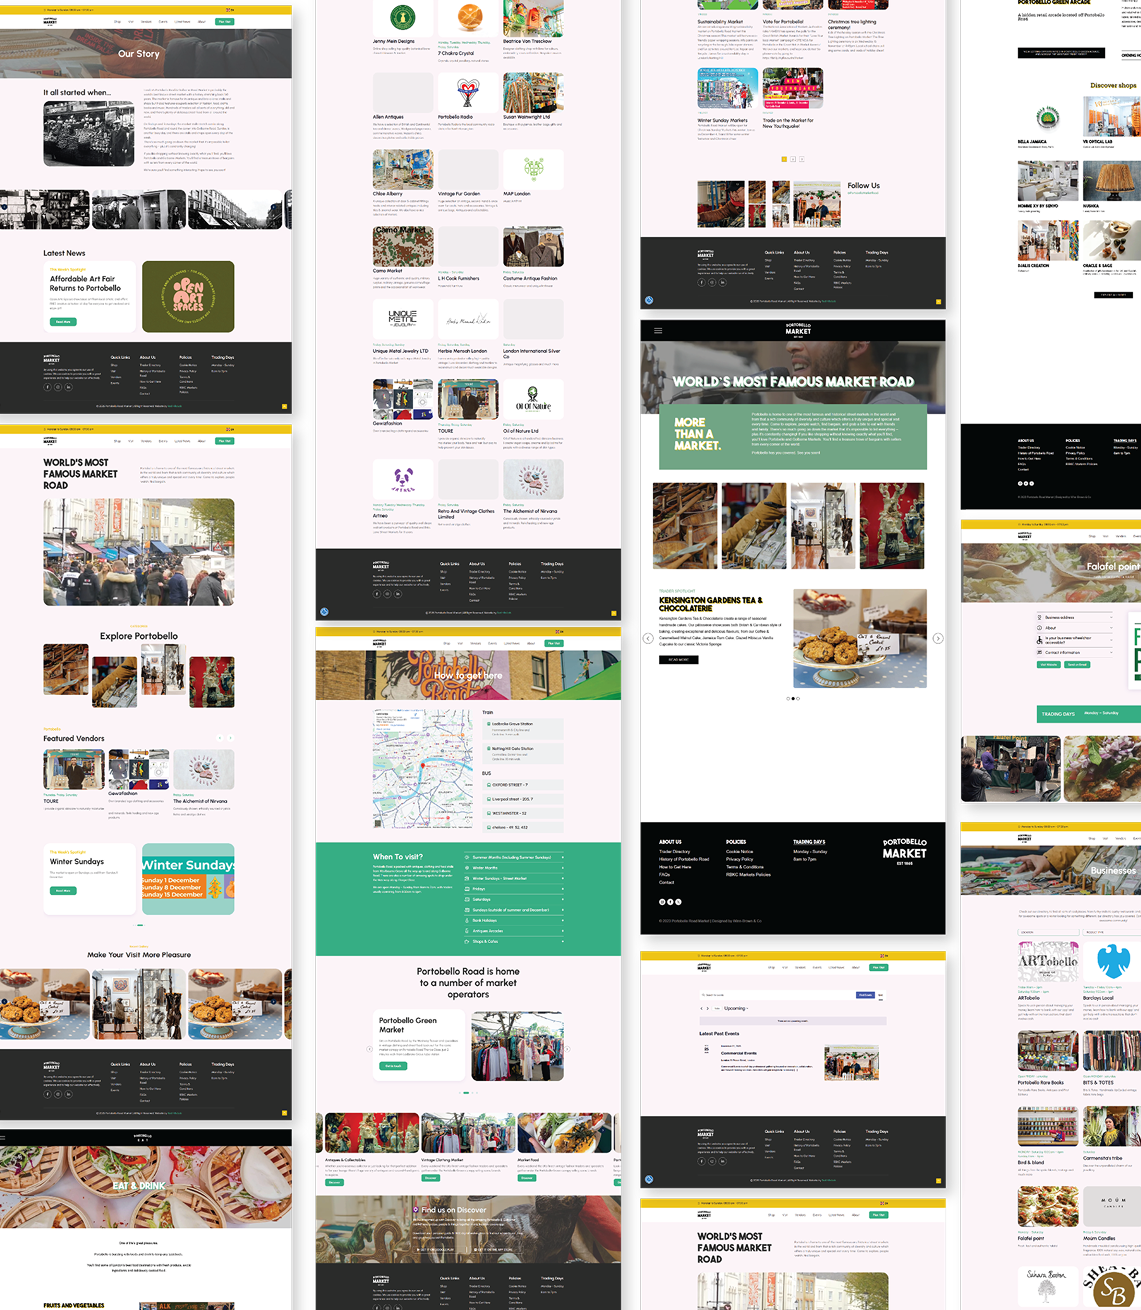
Visit Portobello

The collaboration

Jointly managed by Royal Borough of Kensington and Chelsea and Westway Trust, Visit Portobello is the official website for Portobello Road Market.
Explore Our Work
Red computer mouse outline with two scroll buttons and a cable.
We partner with visionary organizations to redefine what's possible.
Visit Portobello
Each year, the platform attracts over 500,000 visitors planning trips to one of the world’s most iconic street markets. While popular, we identified opportunities to significantly improve the user experience and unlock sustainable revenue to reinvest into the platform’s growth.
Client
Visit Portobello
Services
UX/UI, Web Development, Graphic Design, Strategy
Year
2025
Location
London, UK
UX/UI Design

Crafting the User Journey

Our design process focused on creating a user-centered platform that makes discovering and exploring Portobello Road Market effortless and engaging.
01
Strategy & Concept
Seamless transition from digital discovery to physical arrival.
02
Branding & Design
Seamless transition from digital discovery to physical arrival.
03
Design & Development
Seamless transition from digital discovery to physical arrival.
04
Sales & Marketing
Seamless transition from digital discovery to physical arrival.
Development

Cutting-Edge Technologies

Built with modern technologies and best practices to deliver a fast, secure, and scalable web platform that delights users.
Build Platform
WordPress
CMS
WordPress
Performance +
Optimization
WordPress
Hosting
WordPress
Transformation

the Transformation

From a fragmented, slow, and non-responsive legacy site to a world-class digital destination.
Mobile screen showing Portobello Market website with colorful buildings and a crowded market street photo.
Collage of website pages showcasing Portobello Market history, vendor listings, event info, maps, and food photos.
Website Analytics

Measuring Growth

The impact of the new platform was immediate. By focusing on core web vitals and user experience, we saw significant improvements across all key performance indicators.
Avg. Page Load Speed
Before
5.2s
After
1.2s
Lighthouse Performance
Before
42/100
After
98/100
Monthly Traffic Growth
Before
+2% Avg
After
+25% Avg
Bounce Rate
Before
78%
After
24%